Proform Race Guides: Benchmarks vs Filters — Help Guide
Understanding the Two-Row Comparison
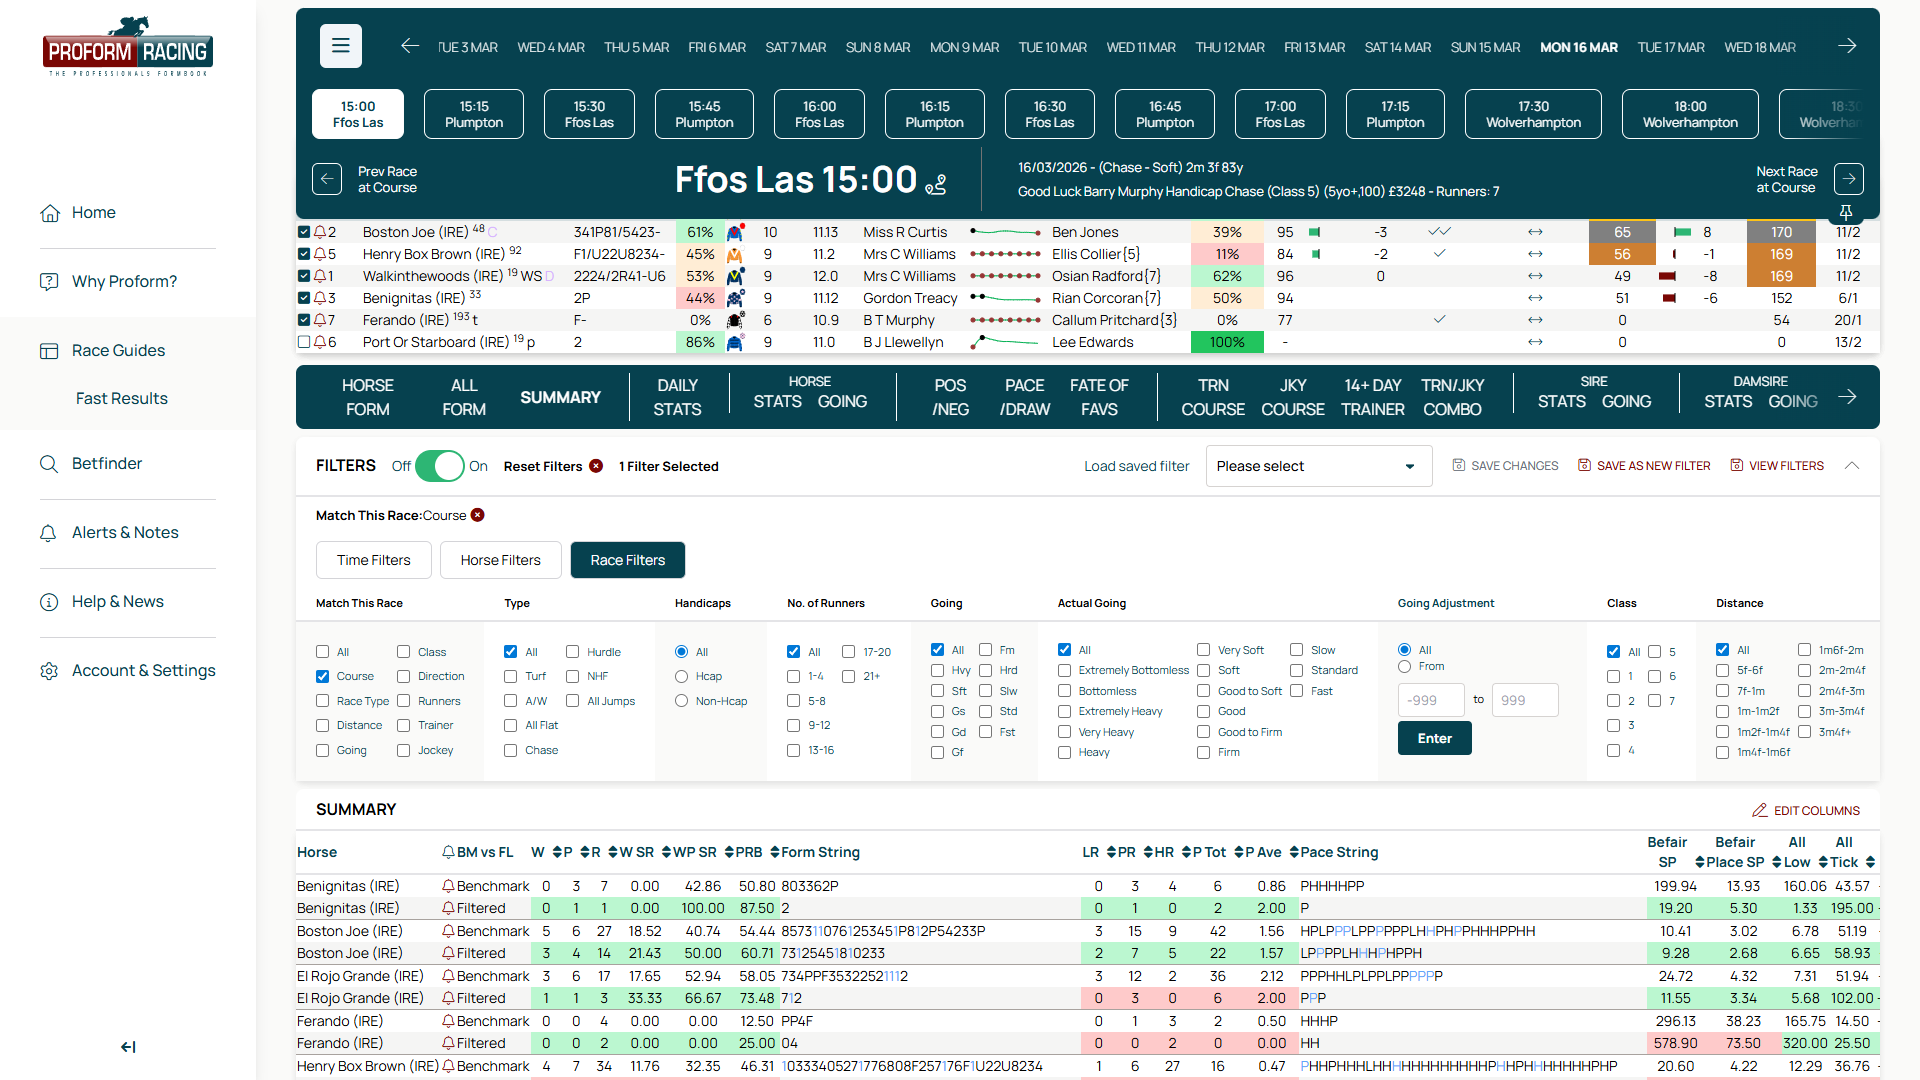
When you apply a filter in Proform Race Guides, each runner's statistics display in two rows: Benchmark and Filtered.
Benchmark shows career-wide data across all of a runner's starts. Filtered shows data only from races matching your filter criteria.
How This Works in Practice
Apply a filter — by track, going, distance, race class, or any other parameter — and the Race Guides data tabs immediately recalculate. The Benchmark row remains constant; the Filtered row updates to reflect only the subset of races you've selected.
This side-by-side format lets you see whether a runner's form improves or declines under specific conditions.
Using Filters Effectively
- Compare Benchmark to Filtered to identify course specialists or distance preferences
- Filter by going to assess performance on firm, good, or soft ground
- Filter by class to spot horses that raise their game (or drop off) at certain levels
- Combine multiple filters to isolate exact race types
For detailed instructions on setting up and using filters in Proform Race Guides, visit the full help guide.