Sectionals: Detailed Race Performance Data at Your Fingertips
The Sectionals feature gives RaceMetrics users a granular view of how each horse performed throughout a race. Rather than looking at finishing position alone, you can examine timing, speed, and position data at every furlong marker—revealing the true dynamics of a race.
What You Get Access To
Sectionals requires a Platinum subscription plus the Sectionals Add-On. Once you have access, the feature appears as a button on the racecard page for races where data is available.
14 Tabs of Performance Analysis
The feature includes 14 separate analysis tabs, each presenting race data from a different angle.
The Metrics Tab: The Full Picture
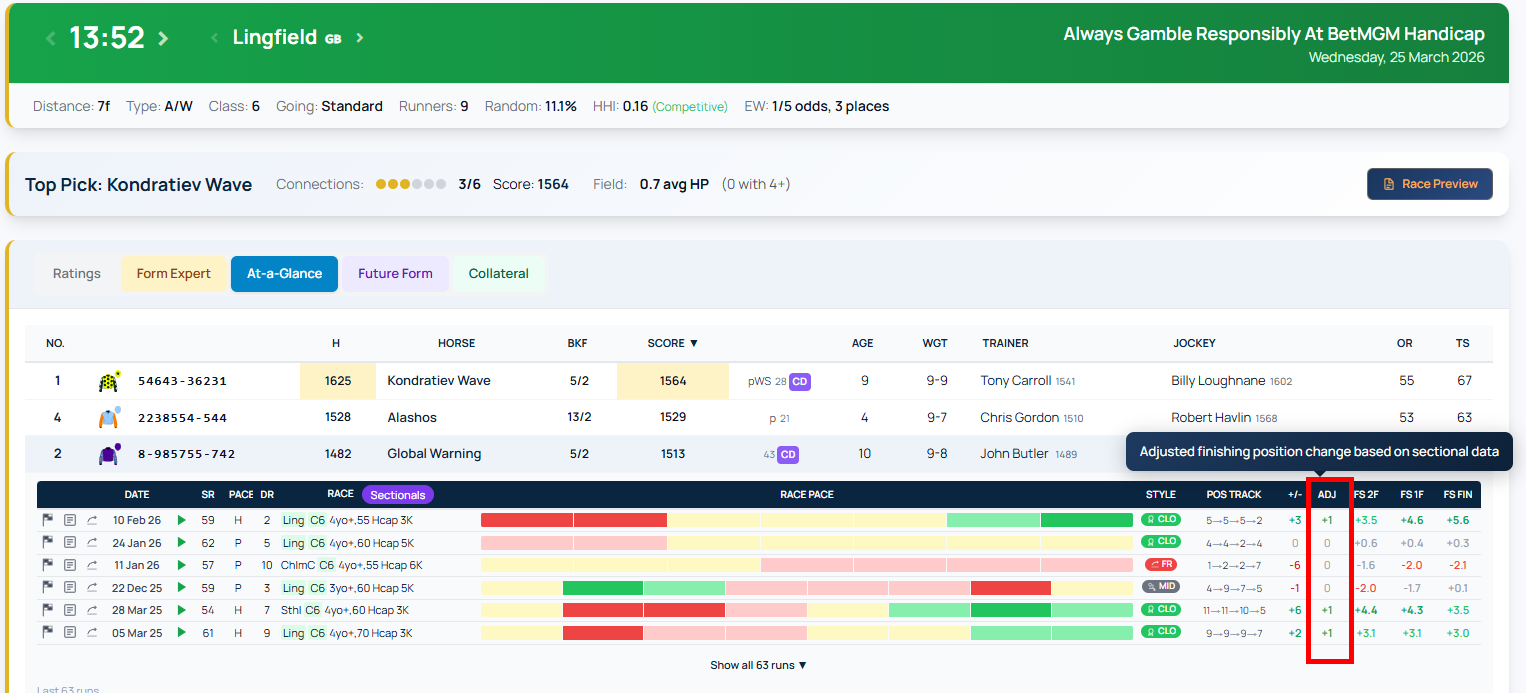
Start here for a comprehensive overview. The Metrics tab combines upgrade analysis, acceleration times, speed, and stride data in a single sortable table. Green shading highlights the best value in each column; red shows the lowest.
Key metrics include finishing position, distance to winner, and maximum upgrade potential—showing how many pounds a horse could have improved by running more efficiently. You'll also see acceleration data (time to reach 5, 10, 20, 25, and 30 mph), top speed, and stride measurements (length and frequency).
All column headers are sortable. Click once to sort ascending, again to reverse. Hover over any header for an explanation of that metric.
The Times Tab: Furlong-by-Furlong Breakdown
This tab displays the time (in seconds) for each furlong section, with par times shown in the header row. You can switch between seconds, miles per hour, or kilometres per hour, depending on your preference. Colour coding shows which sections ran faster than par (green) and which ran slower (red).
Why This Matters
Sectionals data reveals race dynamics invisible in final results alone—whether a horse ran evenly, made a late surge, or faded under pressure. This detail is essential for form analysis and identifying genuine performance trends.