Meeting Pace & Draw Analysis: Understanding Track Conditions and Stall Advantage
RaceMetrics' Meeting Pace & Draw Analysis tool breaks down how a day's racing actually unfolded—revealing whether the track favoured front-runners or closers, and which draw positions held an edge. It's built on sectional pace data and draw bias metrics, giving you the context behind individual race results.
What the tool shows
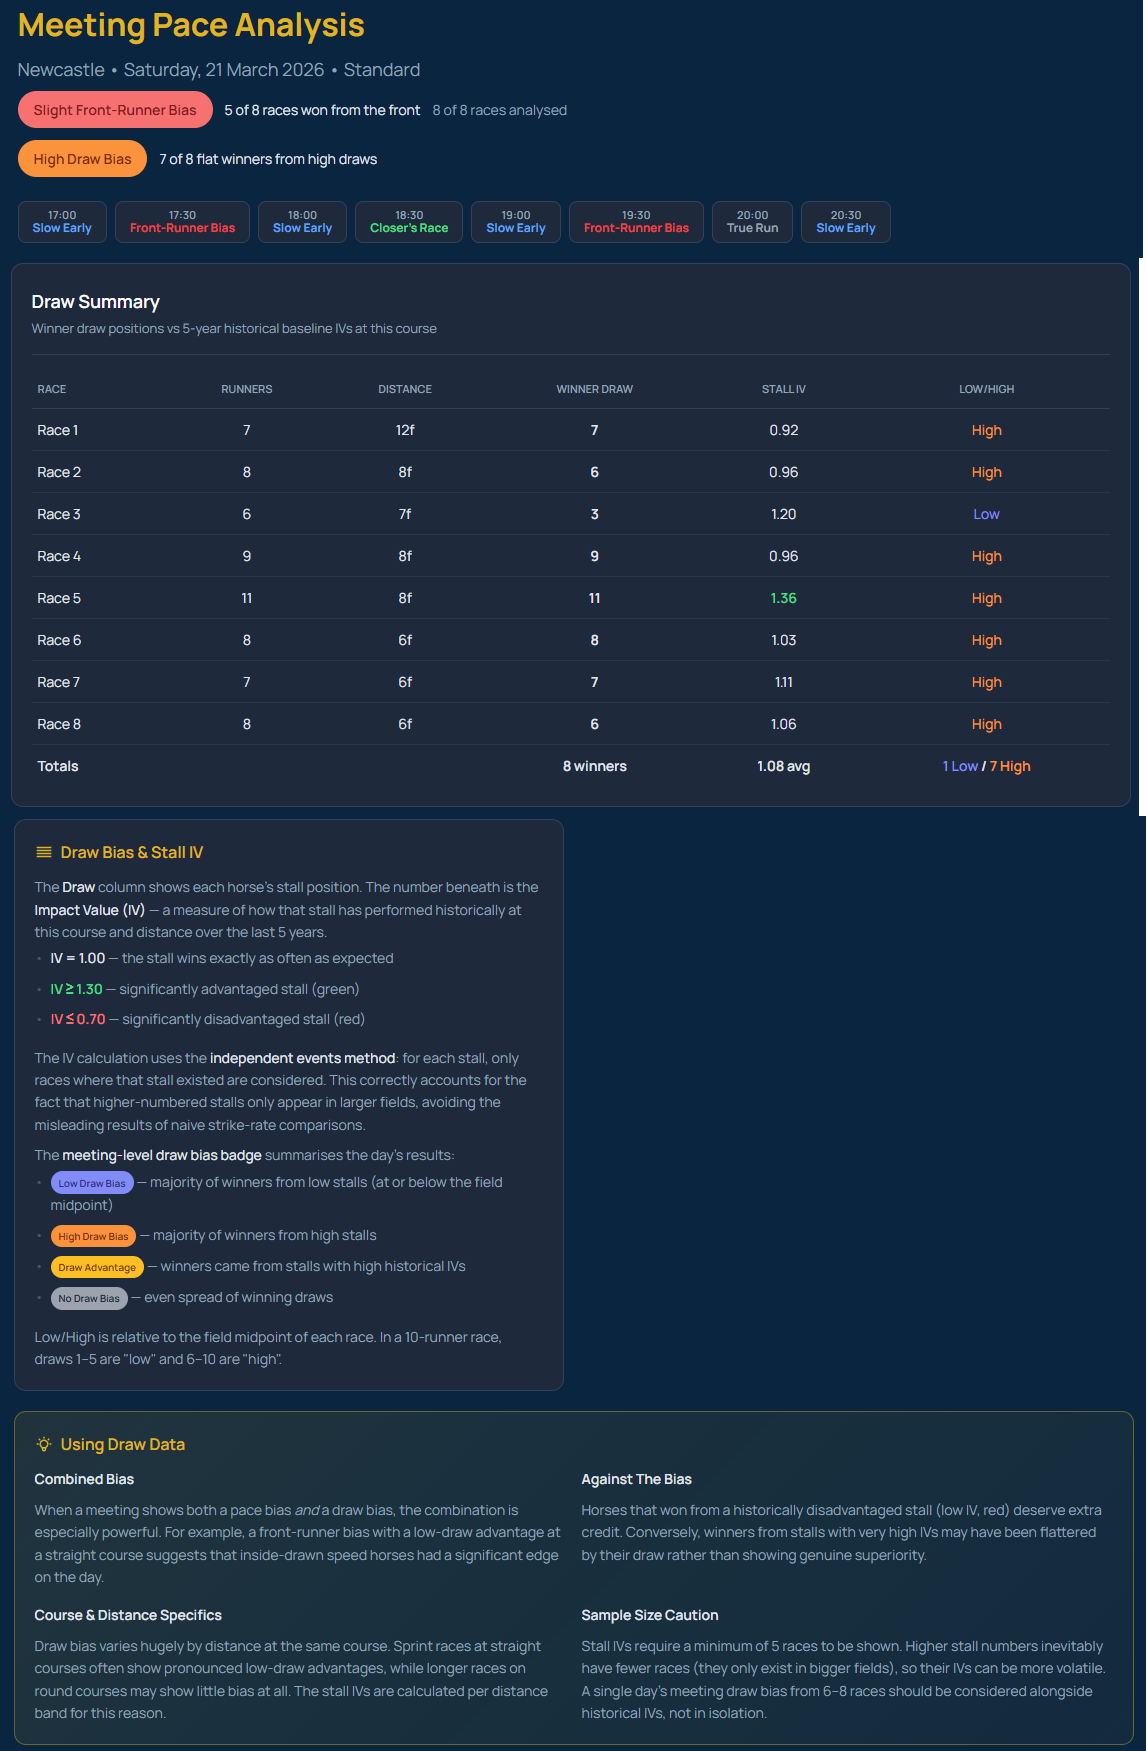
The feature displays two key pieces of information: how the pace evolved across each race, and whether certain draw positions produced winners at significantly higher rates than others. You'll see pace bars showing the tempo of racing, sectional times for each runner, and draw impact values that tell you how historically productive each stall has been at that course and distance.
At the top of the page, meeting-level bias badges summarise the day's overall characteristics. A pace bias badge indicates whether closers or front-runners dominated the winner's circle. Draw bias badges show whether low draws, high draws, or specific high-performing stalls drove success.
Two modes depending on your data
GB flat meetings with sectional data run in full mode, displaying pace analysis alongside draw breakdown. Irish flat meetings and other venues without sectional timing use draw-only mode, focusing entirely on stall advantage with per-race summaries and a collated draw table.
How to access it
From any past racecard with results, click the Meeting Pace button in the race header. Alternatively, from the Dashboard results view, select the Meeting Pace Analysis pill next to a course that has sectional data. Irish meetings show a Meeting Draw Analysis button instead.
Access requires a Platinum subscription with the Sectionals Add-On.
Why it matters
Understanding track bias helps explain why certain horses succeeded or failed on the day—and informs how to read future races at the same venue. Stall impact values show you which gates have historical edge, beyond mere draw position.